Here are some actually helpful DevTools techniques you can use daily.
1. Locate slow paint/layout issues with Performance and Paint Profiler
- Why: Slow paints and layout thrashing cause jank (stuttered animations, delayed interactions).
- How:
- Open DevTools → Performance (Chrome/Edge) or Performance tab (Firefox).
- Click Record, reproduce the interaction (scroll, animate, click), then Stop.
- Inspect Main thread: check long tasks (>50ms) and “Layout” / “Paint” events.
- In Chrome, open the “Rendering” pane (three-dot → More tools → Rendering) and enable “Paint flashing” to visualize repaints.
- What to look for: Frequent layout events after small DOM changes, large paint rectangles, long style/layout times.
- Tips:
- Temporarily disable heavy CSS (transform/box-shadow) to confirm if paint cost drops.
- Use will-change sparingly—only for short-lived transitions.
- Tools: Chrome Performance, Firefox Performance, Lighthouse.
- Code snippet to avoid layout thrash:
js
// Bad: reading layout in a loop
items.forEach(el => { el.classList.add('open'); total += el.offsetHeight; });
// Better: batch DOM reads/writes
items.forEach(el => el.classList.add('open'));
let total = items.reduce((sum, el) => sum + el.offsetHeight, 0);
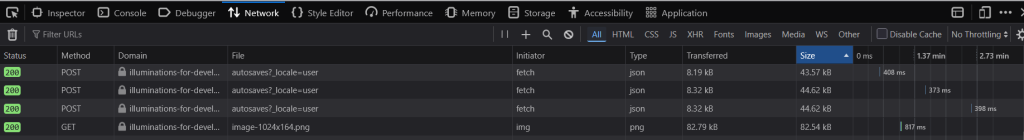
2. Capture exact network conditions and simulate mobile devices
- Why: Reproduce real-world slow networks and device sizes to catch bugs before users.
- How:
- Network tab → Throttling dropdown → choose presets (Fast 3G, Slow 3G) or Add custom.
- Toggle Device Toolbar (Ctrl+Shift+M) to simulate screen size, DPR, and touch.
- Use “Offline” to test offline behavior and service worker fallbacks.
- What to look for: Long time-to-first-byte, large payloads, blocking resources.
- Tips:
- Combine throttling with CPU throttling (Performance → CPU throttle) for more realistic tests.
- Use HAR (Export HAR) to share exact network session details with teammates.
- Tools: Chrome DevTools, WebPageTest for external runs.
- Commands:
bash
# Save network log: right-click → Save all as HAR with content
3. Edit and persist CSS on the fly with Workspaces / Overrides
- Why: Try visual fixes directly in browser and persist them back to disk.
- How (Chrome Workspaces):
- Sources → Filesystem → Add folder to workspace, grant permission.
- Map network resource to local file.
- Edit CSS/JS in Sources; save (Ctrl+S) writes to disk.
- How (Overrides, when workspace not possible):
- Sources → Overrides → Select folder, grant permission.
- Enable “Enable Local Overrides”. Edits to any loaded file get stored locally and reapplied on reload.
- What to look for: Quick CSS tweaks that require page reload confirmation; map to proper files to avoid confusion.
- Tips:
- Keep a git branch for experiments; commit only intentional changes.
- For React/Vite/etc., use fast refresh but still test final built CSS via overrides.
- Tools: Chrome Workspaces, Local Overrides, VS Code + live-server for parallel editing.
4. Debug async code with Async Call Stacks & Blackboxing
- Why: Understand full call stack across promises and skip libraries that clutter call stacks.
- How:
- Sources → check “Enable async stack traces” (usually on).
- Right-click file in Call Stack → Blackbox script (e.g., node_modules) to hide internal frames.
- Set breakpoints (conditional, logpoints) and step through async flows.
- What to look for: Promise microtasks, missing awaits, unhandled rejections.
- Tips:
- Use conditional breakpoints to avoid stopping too often (right-click → Add conditional breakpoint).
- Use console.assert for quick runtime checks without pausing.
- Code snippet:
js
// Conditional breakpoint example: only break when userId === 42
if (userId === 42) debugger;
5. Use Snippets for quick automation and repro helpers
- Why: Automate repetitive inspection tasks (seed test data, toggle features).
- How:
- Sources → Snippets → New snippet.
- Save JS code; right-click → Run or run via console with: snippetName().
- What to look for: Snippets that recreate states hard to reach via UI.
- Tips:
- Store commonly used snippets in your workspace and share with team.
- Example snippet (fill form):
js
(() => {
  document.querySelector('#name').value = 'Test User';
  document.querySelector('#email').value = 'qa@example.com';
})();
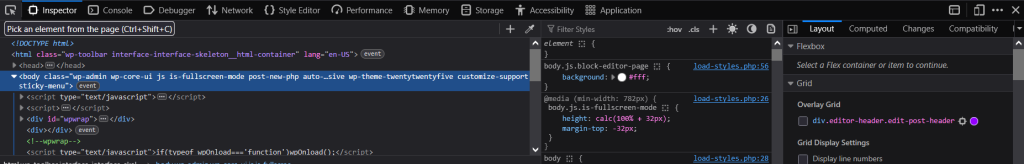
6. Audit accessibility with Accessibility pane and Lighthouse
- Why: Catch keyboard, contrast, and ARIA issues early.
- How:
- Elements → Accessibility or Audits/ Lighthouse → Accessibility report.
- Use “Tab” to navigate and “Focus” overlay to see focusable elements.
- Check computed ARIA properties and name/role mappings.
- What to look for: Missing alt text, low contrast, tabindex misuse, missing labels.
- Tips:
- Use axe-core or WAVE for deeper checks; Lighthouse gives actionable fixes.
- Tools & commands:
- npm: npm install -g @axe-core/cli && axe page.html

7. Live-edit JS pretty-print and map minified code back to source
- Why: Debug production minified code when source maps aren’t available.
- How:
- Sources → open minified .js → click {} pretty-print to format.
- Use “Search” to find likely function names, set breakpoints.
- If source maps exist, DevTools will show original files automatically.
- What to look for: Inline eval’d code, dynamically generated functions, missing maps.
- Tips:
- Use sourcemap explorers (sourcemap.spec.whatwg.org) and build tools to ensure maps are generated and uploaded to Sentry or your error tracking.
- Example: Add source-map support in Webpack:
js
module.exports = { devtool: 'source-map' };
8. Memory leak detection with Allocation instrumentation and Heap snapshots
- Why: Unbounded memory growth leads to crashes and degraded performance.
- How:
- Performance → Memory or Memory tab (Chrome).
- Use “Allocation instrumentation on timeline” and record while reproducing the issue.
- Take heap snapshots (Memory → Take snapshot) and compare over time (detached nodes, retained size).
- What to look for: Detached DOM nodes, large retained trees, closures holding large objects.
- Tips:
- Force GC (Collect garbage) before snapshots to reduce noise.
- Track event listeners: use getEventListeners(elem) in console.
- Commands/snippets:
js
// Find listeners
getEventListeners(document.querySelector('#btn'))
9. Edit request/response bodies and replay network requests
- Why: Test server-edge cases without changing backend code.
- How:
- Network tab → right-click request → Save as HAR.
- Use “Replay XHR” (in some DevTools) or copy request as cURL → modify → curl to replay.
- Use Request Blocking (Network → Block request URL) to simulate missing resources.
- What to look for: Error handling, fallback UI, resumable uploads.
- Tips:
- Use Postman/Insomnia for complex API replay and mutation.
- Example: Copy as cURL and tweak:
bash
curl 'https://api.example.com/data' -H 'Authorization: Bearer x' --data '{"bad":"data"}'
10. Time travel with Recorder and Puppeteer/Playwright integration
- Why: Record flows and replay for debugging or automated regression tests.
- How:
- Chrome Recorder tab → Record user flows → export to Puppeteer/Playwright or replay.
- Use exported script in CI to run deterministic flows.
- What to look for: Flaky selectors, timing-based failures.
- Tips:
- Prefer data-test-id selectors to avoid brittle tests.
- Example (Playwright export snippet):
js
const { test, expect } = require('@playwright/test');
test('flow', async ({ page }) => {
  await page.goto('https://example.com');
  await page.click('data-test=login');
});
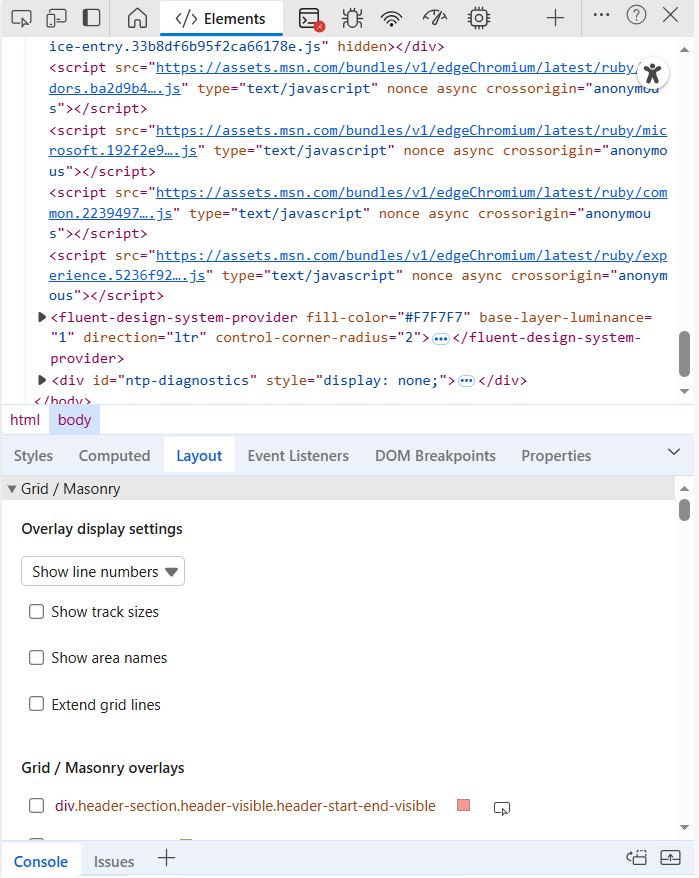
11. CSS Overview and Coverage to prune unused styles
- Why: Reduce CSS payload and improve first paint.
- How:
- CSS Overview (three-dot → More tools → CSS Overview) to get bundle breakdown (colors, fonts, unused declarations).
- Coverage (three-dot → More tools → Coverage) → Start instrumenting → reload to see unused JS/CSS bytes.
- What to look for: Large unused CSS blocks, duplicated rules, large fonts.
- Tips:
- Use PurgeCSS/Uncss in build pipeline, but validate visually—dynamic classes may be removed.
- Tooling: PurgeCSS, PurgeCSS + Tailwind config safelisting.
12. Use Console Utilities and formatters for faster debugging
- Why: Quickly inspect elements, objects, and run helper utilities.
- How:
- In console, use $0, $1 to reference last inspected elements; $$() for querySelectorAll; $x() for XPath.
- console.table(), console.group(), console.time()/timeEnd() for structured logs.
- Register custom formatters for complex objects (Chrome DevTools custom formatters).
- What to look for: Too much noisy logging—use levels and structured output.
- Tips:
- Use console.profile()/console.profileEnd() to tie CPU profiles to code runs.
- Snippets:
js
console.time('render');
// ... render logic
console.timeEnd('render');
console.table([{name:'a',size:10},{name:'b',size:20}]);
13. Traffic inspection and modifying headers with Requestly or DevTools
- Why: Simulate CORS, auth, or header changes locally.
- How:
- Use browser extension Requestly or ModHeader to change request/response headers.
- Or use Chrome DevTools “Network conditions” or a local proxy (mitmproxy) to rewrite headers.
- What to look for: CORS failures, caching headers, content-security-policy issues.
- Tips:
- For secure HTTPS interception, use mitmproxy with proper certificates.
- Tools: Requestly, ModHeader, mitmproxy, Fiddler.
14. Trace Rendering with Layers and Paint Profiler
- Why: Understand which layers are composited and accelerate with GPU.
- How:
- Rendering panel → Show layer borders, Show FPS meter.
- Performance recording → View “Layers” tab to inspect which elements made their own layer.
- What to look for: Too many layers (costly) or missing layers for animating elements (causes repaint).
- Tips:
- Use transform: translateZ(0) or will-change to trigger composite layers for animations (test impact first).
- Note: Excess layers increase memory and GPU cost—balance is key.
15. Source-map management and verifying production mapping
- Why: Proper source maps make production debugging feasible and reduce time-to-fix.
- How:
- Ensure build tool generates source maps (devtool: ‘source-map’ or similar).
- Upload source maps to error-tracking services (Sentry, Rollbar) and strip sources if needed for privacy.
- Verify in Production: open DevTools on production bundle—check “Sources” for original files.
- What to look for: Missing maps, incorrect paths, inline source maps exposing source code.
- Tips:
- Use hidden or obfuscated maps for public bundles; prefer private upload to error tracker.
- Commands (Webpack):
js
module.exports = { devtool: 'hidden-source-map' };